


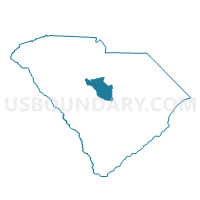
Dutch Fork CCD, Richland County, South Carolina
About
Outline

Summary
| Unique Area Identifier | 151365 |
| Name | Dutch Fork CCD |
| County | Richland County |
| State | South Carolina |
| Area (square miles) | 88.52 |
| Land Area (square miles) | 83.56 |
| Water Area (square miles) | 4.96 |
| % of Land Area | 94.40 |
| % of Water Area | 5.60 |
| Latitude of the Internal Point | 34.13367640 |
| Longtitude of the Internal Point | -81.20192770 |
| Total Population | 73,262 |
| Total Housing Units | 30,800 |
| Total Households | 27,983 |
| Median Age | 33.9 |
Maps

Graphs
Select a template below for downloading or customizing gragh for Dutch Fork CCD, Richland County, South Carolina


Neighbors
Neighoring County Subdivision (by Name) Neighboring County Subdivision on the Map
- Camp Ground CCD, Richland County, SC
- Chapin CCD, Lexington County, SC
- Columbia CCD, Richland County, SC
- Irmo CCD, Lexington County, SC
- Prosperity CCD, Newberry County, SC
- West Columbia-Cayce CCD, Lexington County, SC
- Winnsboro South CCD, Fairfield County, SC
Top 10 Neighboring Place (by Population) Neighboring Place on the Map
- Columbia city, SC (129,272)
- St. Andrews CDP, SC (20,493)
- Seven Oaks CDP, SC (15,144)
- West Columbia city, SC (14,988)
- Irmo town, SC (11,097)
- Lake Murray of Richland CDP, SC (5,484)
Top 10 Neighboring Unified School District (by Population) Neighboring Unified School District on the Map
- Richland School District 1, SC (201,528)
- Lexington School District 5, SC (91,018)
- Lexington School District 2, SC (63,322)
- Newberry County School District, SC (37,508)
- Fairfield County School District, SC (23,956)
Top 10 Neighboring State Legislative District Lower Chamber (by Population) Neighboring State Legislative District Lower Chamber on the Map
- State House District 71, SC (45,921)
- State House District 77, SC (45,080)
- State House District 69, SC (42,328)
- State House District 72, SC (40,039)
- State House District 40, SC (34,899)
- State House District 85, SC (34,760)
- State House District 89, SC (33,501)
- State House District 41, SC (31,110)
- State House District 73, SC (31,016)
Top 10 Neighboring State Legislative District Upper Chamber (by Population) Neighboring State Legislative District Upper Chamber on the Map
- State Senate District 19, SC (105,577)
- State Senate District 20, SC (103,494)
- State Senate District 18, SC (95,143)
- State Senate District 26, SC (91,335)
- State Senate District 17, SC (88,026)
Top 10 Neighboring 111th Congressional District (by Population) Neighboring 111th Congressional District on the Map
- Congressional District 2, SC (825,324)
- Congressional District 5, SC (767,773)
- Congressional District 6, SC (682,410)
Top 10 Neighboring Census Tract (by Population) Neighboring Census Tract on the Map
- Census Tract 103.09, Richland County, SC (8,948)
- Census Tract 103.07, Richland County, SC (8,372)
- Census Tract 103.06, Richland County, SC (7,923)
- Census Tract 103.04, Richland County, SC (7,126)
- Census Tract 103.05, Richland County, SC (7,004)
- Census Tract 104.08, Richland County, SC (6,166)
- Census Tract 9506.02, Newberry County, SC (5,877)
- Census Tract 103.08, Richland County, SC (5,857)
- Census Tract 102, Richland County, SC (5,505)
- Census Tract 9605, Fairfield County, SC (5,275)
Top 10 Neighboring 5-Digit ZIP Code Tabulation Area (by Population) Neighboring 5-Digit ZIP Code Tabulation Area on the Map
- 29210, SC (40,356)
- 29203, SC (39,843)
- 29063, SC (32,717)
- 29212, SC (28,798)
- 29169, SC (22,845)
- 29201, SC (20,594)
- 29036, SC (19,140)
- 29180, SC (14,267)
- 29075, SC (2,963)
- 29065, SC (677)
Data
Demographic, Population, Households, and Housing Units
** Data sources from census 2010 **
Show Data on Map
Download Full List as CSV
Download Quick Sheet as CSV
| Subject | This Area | Richland County | South Carolina | National |
|---|---|---|---|---|
| POPULATION | ||||
| Total Population Map | 73,262 | 384,504 | 4,625,364 | 308,745,538 |
| POPULATION, HISPANIC OR LATINO ORIGIN | ||||
| Not Hispanic or Latino Map | 71,093 | 365,867 | 4,389,682 | 258,267,944 |
| Hispanic or Latino Map | 2,169 | 18,637 | 235,682 | 50,477,594 |
| POPULATION, RACE | ||||
| White alone Map | 40,096 | 181,974 | 3,060,000 | 223,553,265 |
| Black or African American alone Map | 29,270 | 176,538 | 1,290,684 | 38,929,319 |
| American Indian and Alaska Native alone Map | 207 | 1,230 | 19,524 | 2,932,248 |
| Asian alone Map | 1,419 | 8,548 | 59,051 | 14,674,252 |
| Native Hawaiian and Other Pacific Islander alone Map | 51 | 425 | 2,706 | 540,013 |
| Some Other Race alone Map | 791 | 7,358 | 113,464 | 19,107,368 |
| Two or More Races Map | 1,428 | 8,431 | 79,935 | 9,009,073 |
| POPULATION, SEX | ||||
| Male Map | 36,956 | 187,330 | 2,250,101 | 151,781,326 |
| Female Map | 36,306 | 197,174 | 2,375,263 | 156,964,212 |
| POPULATION, AGE (18 YEARS) | ||||
| 18 years and over Map | 55,933 | 296,951 | 3,544,890 | 234,564,071 |
| Under 18 years | 17,329 | 87,553 | 1,080,474 | 74,181,467 |
| POPULATION, AGE | ||||
| Under 5 years | 4,621 | 24,463 | 302,297 | 20,201,362 |
| 5 to 9 years | 4,738 | 24,038 | 295,853 | 20,348,657 |
| 10 to 14 years | 4,663 | 23,746 | 297,286 | 20,677,194 |
| 15 to 17 years | 3,307 | 15,306 | 185,038 | 12,954,254 |
| 18 and 19 years | 1,887 | 18,052 | 143,951 | 9,086,089 |
| 20 years | 1,100 | 9,940 | 73,846 | 4,519,129 |
| 21 years | 1,153 | 8,860 | 69,700 | 4,354,294 |
| 22 to 24 years | 4,032 | 22,022 | 188,948 | 12,712,576 |
| 25 to 29 years | 6,685 | 31,273 | 304,378 | 21,101,849 |
| 30 to 34 years | 5,717 | 26,705 | 287,678 | 19,962,099 |
| 35 to 39 years | 5,631 | 25,395 | 296,682 | 20,179,642 |
| 40 to 44 years | 5,627 | 24,450 | 304,610 | 20,890,964 |
| 45 to 49 years | 5,782 | 26,116 | 332,766 | 22,708,591 |
| 50 to 54 years | 5,063 | 25,452 | 326,662 | 22,298,125 |
| 55 to 59 years | 4,030 | 22,558 | 303,240 | 19,664,805 |
| 60 and 61 years | 1,479 | 8,093 | 115,411 | 7,113,727 |
| 62 to 64 years | 1,786 | 10,494 | 165,144 | 9,704,197 |
| 65 and 66 years | 920 | 5,555 | 92,218 | 5,319,902 |
| 67 to 69 years | 1,231 | 6,992 | 123,343 | 7,115,361 |
| 70 to 74 years | 1,340 | 8,550 | 153,482 | 9,278,166 |
| 75 to 79 years | 1,040 | 6,772 | 113,248 | 7,317,795 |
| 80 to 84 years | 731 | 5,010 | 78,866 | 5,743,327 |
| 85 years and over | 699 | 4,662 | 70,717 | 5,493,433 |
| MEDIAN AGE BY SEX | ||||
| Both sexes Map | 33.90 | 32.60 | 37.90 | 37.20 |
| Male Map | 32.80 | 30.90 | 36.40 | 35.80 |
| Female Map | 35.10 | 34.40 | 39.20 | 38.50 |
| HOUSEHOLDS | ||||
| Total Households Map | 27,983 | 145,194 | 1,801,181 | 116,716,292 |
| HOUSEHOLDS, HOUSEHOLD TYPE | ||||
| Family households: Map | 17,066 | 89,357 | 1,216,415 | 77,538,296 |
| Husband-wife family Map | 11,643 | 57,541 | 849,959 | 56,510,377 |
| Other family: Map | 5,423 | 31,816 | 366,456 | 21,027,919 |
| Male householder, no wife present Map | 1,066 | 6,154 | 85,354 | 5,777,570 |
| Female householder, no husband present Map | 4,357 | 25,662 | 281,102 | 15,250,349 |
| Nonfamily households: Map | 10,917 | 55,837 | 584,766 | 39,177,996 |
| Householder living alone Map | 8,855 | 43,828 | 477,894 | 31,204,909 |
| Householder not living alone Map | 2,062 | 12,009 | 106,872 | 7,973,087 |
| HOUSEHOLDS, HISPANIC OR LATINO ORIGIN OF HOUSEHOLDER | ||||
| Not Hispanic or Latino householder: Map | 27,345 | 140,383 | 1,742,066 | 103,254,926 |
| Hispanic or Latino householder: Map | 638 | 4,811 | 59,115 | 13,461,366 |
| HOUSEHOLDS, RACE OF HOUSEHOLDER | ||||
| Householder who is White alone | 16,204 | 73,857 | 1,257,573 | 89,754,352 |
| Householder who is Black or African American alone | 10,635 | 64,144 | 472,049 | 14,129,983 |
| Householder who is American Indian and Alaska Native alone | 74 | 436 | 7,126 | 939,707 |
| Householder who is Asian alone | 477 | 2,727 | 18,490 | 4,632,164 |
| Householder who is Native Hawaiian and Other Pacific Islander alone | 13 | 101 | 754 | 143,932 |
| Householder who is Some Other Race alone | 195 | 1,859 | 27,306 | 4,916,427 |
| Householder who is Two or More Races | 385 | 2,070 | 17,883 | 2,199,727 |
| HOUSEHOLDS, HOUSEHOLD TYPE BY HOUSEHOLD SIZE | ||||
| Family households: Map | 17,066 | 89,357 | 1,216,415 | 77,538,296 |
| 2-person household Map | 6,989 | 37,394 | 538,874 | 31,882,616 |
| 3-person household Map | 4,354 | 22,420 | 290,093 | 17,765,829 |
| 4-person household Map | 3,554 | 17,262 | 225,690 | 15,214,075 |
| 5-person household Map | 1,453 | 7,762 | 101,650 | 7,411,997 |
| 6-person household Map | 495 | 2,865 | 37,394 | 3,026,278 |
| 7-or-more-person household Map | 221 | 1,654 | 22,714 | 2,237,501 |
| Nonfamily households: Map | 10,917 | 55,837 | 584,766 | 39,177,996 |
| 1-person household Map | 8,855 | 43,828 | 477,894 | 31,204,909 |
| 2-person household Map | 1,756 | 8,851 | 84,545 | 6,360,012 |
| 3-person household Map | 224 | 2,034 | 14,005 | 992,156 |
| 4-person household Map | 59 | 890 | 6,213 | 411,171 |
| 5-person household Map | 11 | 169 | 1,364 | 126,634 |
| 6-person household Map | 6 | 36 | 439 | 48,421 |
| 7-or-more-person household Map | 6 | 29 | 306 | 34,693 |
| HOUSING UNITS | ||||
| Total Housing Units Map | 30,800 | 161,725 | 2,137,683 | 131,704,730 |
| HOUSING UNITS, OCCUPANCY STATUS | ||||
| Occupied Map | 27,983 | 145,194 | 1,801,181 | 116,716,292 |
| Vacant Map | 2,817 | 16,531 | 336,502 | 14,988,438 |
| HOUSING UNITS, OCCUPIED, TENURE | ||||
| Owned with a mortgage or a loan Map | 14,034 | 68,667 | 825,417 | 52,979,430 |
| Owned free and clear Map | 2,902 | 20,356 | 423,388 | 23,006,644 |
| Renter occupied Map | 11,047 | 56,171 | 552,376 | 40,730,218 |
| HOUSING UNITS, VACANT, VACANCY STATUS | ||||
| For rent Map | 1,622 | 7,859 | 92,758 | 4,137,567 |
| Rented, not occupied Map | 34 | 241 | 3,957 | 206,825 |
| For sale only Map | 492 | 2,854 | 36,523 | 1,896,796 |
| Sold, not occupied Map | 75 | 472 | 8,519 | 421,032 |
| For seasonal, recreational, or occasional use Map | 172 | 1,076 | 112,531 | 4,649,298 |
| For migrant workers Map | 0 | 5 | 370 | 24,161 |
| Other vacant Map | 422 | 4,024 | 81,844 | 3,652,759 |
| HOUSING UNITS, OCCUPIED, AVERAGE HOUSEHOLD SIZE BY TENURE | ||||
| Total: Map | 2.38 | 2.43 | 2.49 | 2.58 |
| Owner occupied Map | 2.57 | 2.49 | 2.51 | 2.65 |
| Renter occupied Map | 2.10 | 2.34 | 2.45 | 2.44 |
| HOUSING UNITS, OCCUPIED, TENURE BY RACE OF HOUSEHOLDER | ||||
| Owner occupied: Map | 16,936 | 89,023 | 1,248,805 | 75,986,074 |
| Householder who is White alone Map | 12,229 | 52,582 | 955,312 | 63,446,275 |
| Householder who is Black or African American alone Map | 4,148 | 33,064 | 258,651 | 6,261,464 |
| Householder who is American Indian and Alaska Native alone Map | 41 | 220 | 4,197 | 509,588 |
| Householder who is Asian alone Map | 266 | 1,524 | 11,541 | 2,688,861 |
| Householder who is Native Hawaiian and Other Pacific Islander alone Map | 1 | 44 | 310 | 61,911 |
| Householder who is Some Other Race alone Map | 68 | 635 | 9,457 | 1,975,817 |
| Householder who is Two or More Races Map | 183 | 954 | 9,337 | 1,042,158 |
| Renter occupied: Map | 11,047 | 56,171 | 552,376 | 40,730,218 |
| Householder who is White alone Map | 3,975 | 21,275 | 302,261 | 26,308,077 |
| Householder who is Black or African American alone Map | 6,487 | 31,080 | 213,398 | 7,868,519 |
| Householder who is American Indian and Alaska Native alone Map | 33 | 216 | 2,929 | 430,119 |
| Householder who is Asian alone Map | 211 | 1,203 | 6,949 | 1,943,303 |
| Householder who is Native Hawaiian and Other Pacific Islander alone Map | 12 | 57 | 444 | 82,021 |
| Householder who is Some Other Race alone Map | 127 | 1,224 | 17,849 | 2,940,610 |
| Householder who is Two or More Races Map | 202 | 1,116 | 8,546 | 1,157,569 |
| HOUSING UNITS, OCCUPIED, TENURE BY HISPANIC OR LATINO ORIGIN OF HOUSEHOLDER | ||||
| Owner occupied: Map | 16,936 | 89,023 | 1,248,805 | 75,986,074 |
| Not Hispanic or Latino householder Map | 16,645 | 86,921 | 1,223,564 | 69,617,625 |
| Hispanic or Latino householder Map | 291 | 2,102 | 25,241 | 6,368,449 |
| Renter occupied: Map | 11,047 | 56,171 | 552,376 | 40,730,218 |
| Not Hispanic or Latino householder Map | 10,700 | 53,462 | 518,502 | 33,637,301 |
| Hispanic or Latino householder Map | 347 | 2,709 | 33,874 | 7,092,917 |
| HOUSING UNITS, OCCUPIED, TENURE BY HOUSEHOLD SIZE | ||||
| Owner occupied: Map | 16,936 | 89,023 | 1,248,805 | 75,986,074 |
| 1-person household Map | 3,970 | 22,842 | 289,689 | 16,453,569 |
| 2-person household Map | 5,734 | 31,289 | 477,169 | 27,618,605 |
| 3-person household Map | 3,058 | 15,261 | 210,222 | 12,517,563 |
| 4-person household Map | 2,715 | 12,123 | 164,774 | 10,998,793 |
| 5-person household Map | 1,006 | 4,953 | 69,110 | 5,057,765 |
| 6-person household Map | 314 | 1,666 | 24,016 | 1,965,796 |
| 7-or-more-person household Map | 139 | 889 | 13,825 | 1,373,983 |
| Renter occupied: Map | 11,047 | 56,171 | 552,376 | 40,730,218 |
| 1-person household Map | 4,885 | 20,986 | 188,205 | 14,751,340 |
| 2-person household Map | 3,011 | 14,956 | 146,250 | 10,624,023 |
| 3-person household Map | 1,520 | 9,193 | 93,876 | 6,240,422 |
| 4-person household Map | 898 | 6,029 | 67,129 | 4,626,453 |
| 5-person household Map | 458 | 2,978 | 33,904 | 2,480,866 |
| 6-person household Map | 187 | 1,235 | 13,817 | 1,108,903 |
| 7-or-more-person household Map | 88 | 794 | 9,195 | 898,211 |
Loading...